Scientific and Artistic Foundations of Our Star Maps
At Skylit Studio, our star maps are more than just decorative keepsakes — they are grounded in the same astronomical data used by observatories, educators, and amateur astronomers around the world.
Real Star Colours, Just as They Appear in the Sky
After a recent update, every star in our personalised star maps is rendered in its true spectral colour — a reflection of its surface temperature and classification. It's not just design. It's science, visualised.
>30,000 K
10,000–30,000 K
7,500–10,000 K
6,000–7,500 K
5,200–6,000 K
3,700–5,200 K
<3,700 K
These aren't random colours — they're the true hues of stars, based on their surface temperatures and spectral types. From the blazing blue of young O-type stars to the warm glow of ancient M-class giants, every star in your personalised map reflects its real-world light.
That means the star you see in your map is coloured as it actually appeared in the sky — on your chosen date, at your chosen place.
🌠 Why You See More Blue and Yellow Than Red
🔭 Astronomical Truth: Red stars are actually the most common in the universe. M-type red dwarfs make up over 75% of all stars in our galaxy.
However, these stars are:
-
🔅 Very small
- A-, F-, G-, and K-type stars (white to orange) are most prominent
- Some brilliant blue O- and B-type stars appear, even though they’re rare
- M-type stars are usually too faint to appear without overwhelming the map
🔅 Very cool (~2,500–3,500 K)
🔅 Very dim — they emit very little visible light
So while they dominate the cosmos in number, they’re usually too faint to be seen with the naked eye, and often don’t appear in star maps which focus on brighter stars.
🌌 On Your Star Map: We use high-accuracy star catalogues filtered by brightness (magnitude), typically including stars visible from Earth. This means:
That’s why your star map shows more blues, whites, and yellows — it reflects the sky as you’d see it, not just the numbers behind it.
🔆 Understanding Star Magnitude
The magnitude of a star is a measure of its brightness as seen from Earth. The lower the number, the brighter the star appears. Our maps include stars up to magnitude 6 — the faintest visible to the naked eye under dark skies.
Sirius
Vega
💡 Myth Buster: Bright ≠ Always Big
It’s easy to assume that stars appearing larger or brighter on your map must be the biggest — but that’s not always true. The size of a star dot represents how bright the star appears from Earth, not necessarily how big the star actually is.
🌟 Sirius
Brightest star in the sky
- Apparent magnitude: –1.46
- Type: A1V
- Size: ~2× the Sun
- Very bright because it’s very close (~8.6 light-years)
🔴 Betelgeuse
Red supergiant
- Apparent magnitude: ~0.5–1.5
- Type: M1–M2
- Size: ~700× the Sun
- Still bright despite being ~640 light-years away
✨ So remember: a bright dot on your map could mean the star is huge and far away, or small and very close. The night sky is full of surprises.
🔭 Want to see these stars in motion?
Try finding Sirius, Betelgeuse, or Polaris in our interactive sky viewer below!
💡 Can’t spot them right away? Use the search bar in the viewer to locate them instantly.
Every map is a visualisation of the sky as it truly appeared — calculated using precise astronomical algorithms and internationally trusted star catalogues.
🛰️ Astronomical Data Sources
Aesthetic design is blended with accurate celestial positioning based on the following sources:
- Hipparcos & Tycho-2 Star Catalogues
These form the core of positional data. Originally compiled by the European Space Agency, they provide highly accurate coordinates and brightness measurements for over 2 million stars. - Gaia Data Release (ESA)
The most current publicly available release enhances the accuracy of star locations and proper motions, refining how each star is positioned on the final map. - Saguaro Astronomy Club Database
This is referenced for deep-sky objects such as galaxies, nebulae, and star clusters — adding depth and context to the sky. - IAU Official Constellation Boundaries
To ensure constellation outlines are scientifically correct, boundaries defined by the International Astronomical Union (the global authority in astronomy) are used. - Location, Date & Time Precision
Every star map is generated based on the Earth’s exact orbital position (date), axial spin (time of day), and global coordinates (location) — capturing the unique sky from any moment in time. - Enhanced Imagery
Maps draw from high-resolution sky imagery and deep-space visuals, including Wright’s Milky Way render and custom-designed assets, delivering a breathtaking, real-photo quality.
The Timeless Beauty of Star Maps
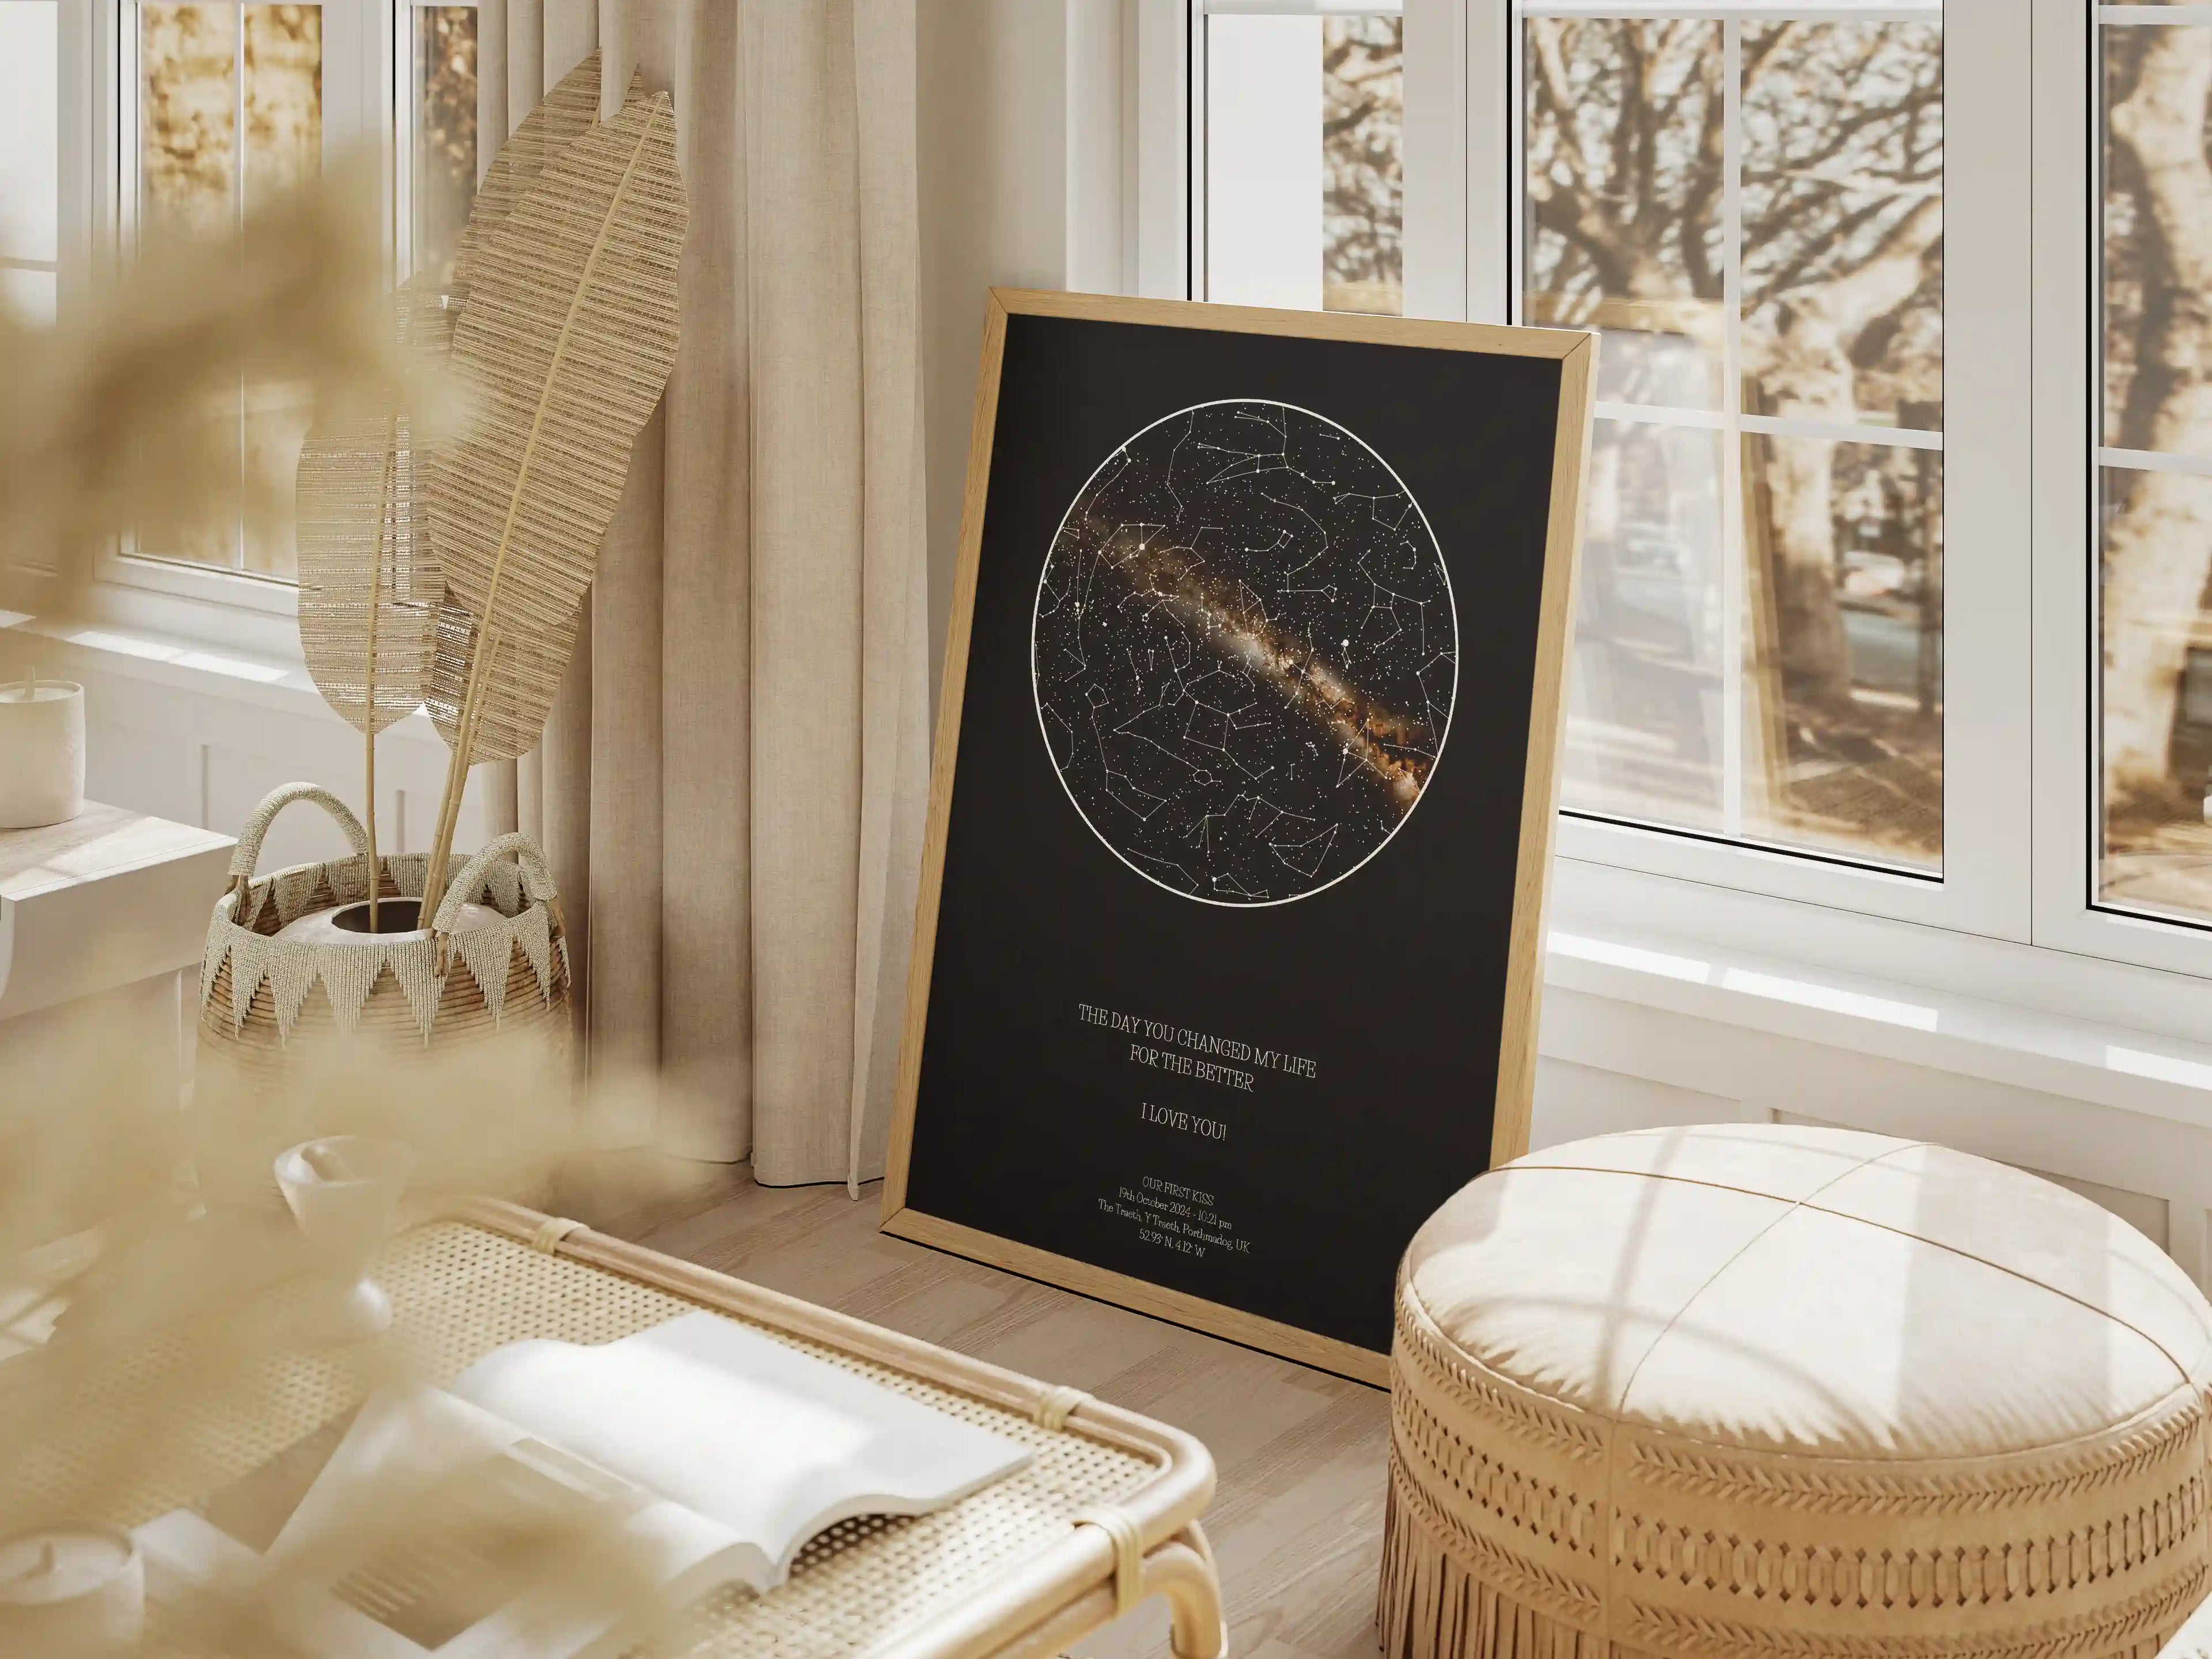
For centuries, humans have gazed at the night sky, finding patterns in the stars and using them for navigation, storytelling, and inspiration. Star maps capture these celestial moments, allowing us to preserve a specific time and place in the cosmos—whether it’s a wedding night, a birth, or another unforgettable event.
Modern star maps blend astronomical data with artistic design, creating personalized representations of the night sky. While inspired by real star positions, they are also a reflection of the emotions and significance tied to a special date.
A star map isn’t just a piece of decor—it’s a way to connect with the universe, celebrate life’s milestones, and keep meaningful memories alive through the stars above.
A Unique and Personalised Experience
Every Skylit Studio map is tailored to your chosen date, time, and location. We combine all these sources and techniques to produce a star map that is:
Accurate: Based on trusted astronomical catalogues.
Meaningful: Incorporating cultural insights and celestial landmarks.
Beautiful: Designed with care to create an artwork as unique as the moment it represents.
Check Our Step-by-step guide how to create Your star map
step by step guide

