There is a camera in space that has been taking the same photograph of Earth for over 50 years. It was launched on the 23rd of July 1972, and it has not stopped since. Today there are two of them, working in tandem, and together they add roughly 1,500 new photographs to the archive every single day. The programme is called Landsat. Most people have never heard of it.
What makes it different from your phone, or a weather satellite, or anything Google Earth shows you, is that it takes calibrated scientific measurements. Every pixel covers a precise 30 metres by 30 metres patch of ground, recorded in wavelengths the human eye cannot see, with the same instruments and reference points across decades. An image from 1985 can be compared directly with an image from 2026, and the difference is real.
Over half a century, that quietly continuous record has shown us things we would otherwise have missed. Here are five places Landsat has changed our understanding of Earth.
1. The Aral Sea, almost gone
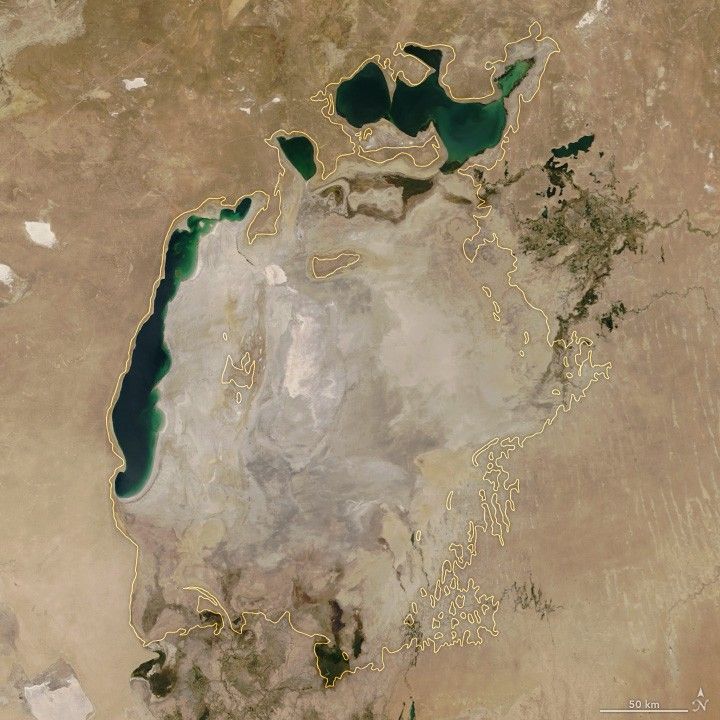
It used to be the fourth-largest lake on Earth. The Aral Sea, on the border of Kazakhstan and Uzbekistan, covered roughly 68,000 square kilometres in 1960. That is about the area of Ireland. Then the Soviet Union began diverting the two rivers that fed it, the Amu Darya and the Syr Darya, to irrigate cotton fields in Central Asia. The sea began to shrink.
Landsat photographed every stage of the collapse from 1972 onwards. The early frames show a lake mostly intact, fringed by snow-fed wetlands. By the 1980s a horseshoe of dry seabed was visible at the eastern edge. By the 2000s the sea had broken into separate bodies. The defining frame came in 2014, when Landsat photographed the eastern lobe of the South Aral Sea entirely disappearing. The remaining water became more than three times saltier than the ocean. Every native fish species died. The exposed lakebed became a toxic plain of pesticide-laden dust that the wind carries hundreds of kilometres.
One detail keeps it from being only a story of loss. In 2005, Kazakhstan used Landsat-derived hydrological models to design and build the Kok-Aral dam at the narrow neck dividing the North Aral from the South. Within a few years the North Aral had partially refilled. Fish came back. Fishermen came back. The South Aral did not recover. Both halves of that story are in the same archive.
Read the full Aral Sea case study →
2. Columbia Glacier, twenty kilometres of ice in forty years
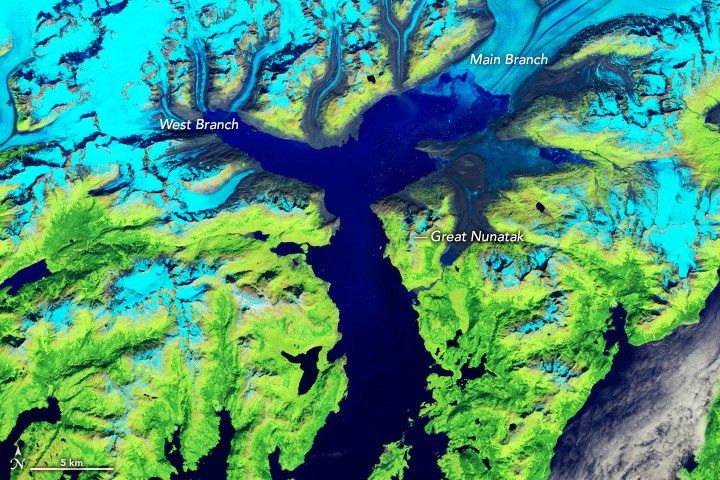
When British explorers charted Columbia Glacier in Alaska in 1794, its terminus touched Heather Island in Prince William Sound. It stayed there for 186 years. Generations of charts, photographs, and expeditions recorded an ice front in roughly the same place. Then, in 1980, something shifted, and the glacier began retreating up its fjord. It has not stopped since.
Landsat satellites 4, 5, 7, 8, and 9 have documented every year of the retreat in false-colour imagery. False colour, because the combination of shortwave-infrared, near-infrared, and green wavelengths makes ice appear in clean blue-white tones and bare rock in stark brown. The main branch has now lost more than 20 kilometres of ice and over half its total volume. In 2011, Landsat captured the moment the terminus split into two separate glacier systems. By 2014, the main branch had lost contact with the seabed and become tidally affected 12 kilometres upstream of its 1980 face. Columbia Glacier alone is now responsible for nearly half of all ice loss in Alaska's Chugach Mountains.
The reason scientists can quantify any of this to the metre is that Landsat is the same camera, with the same calibration, decade after decade. If the satellites kept changing, the comparison would be guesswork. They do not, so it is not.
Read the full Columbia Glacier case study →
3. The Amazon fishbone
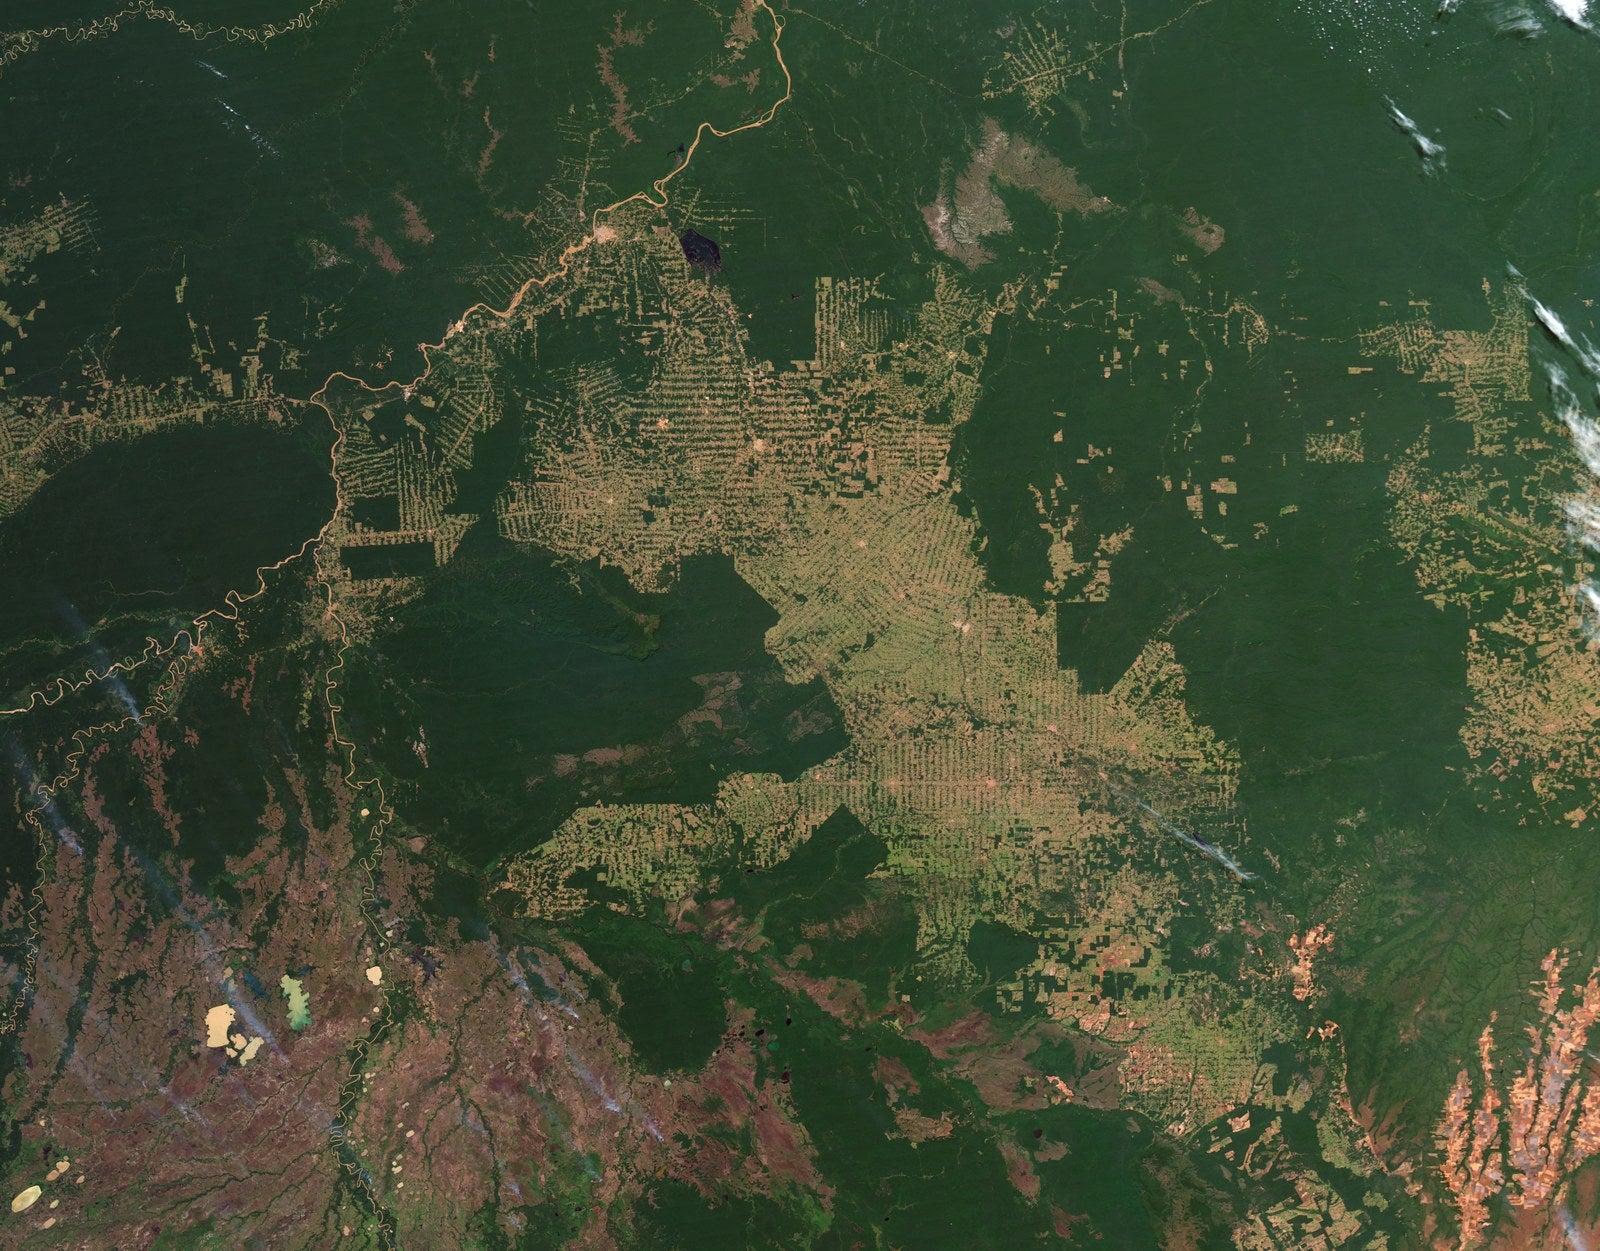
From orbit, you can see exactly how a rainforest dies. Roads appear first, cut into untouched canopy. Then clearings branch off the roads in a regular, geometric pattern that looks like the bones of a fish. Landsat captured this in painful detail in Rondonia, Brazil, where a Kansas-sized stretch of forest was reduced by a third in a single generation.
The numbers tell the story plainly. By 1978, around 4,200 square kilometres had been cleared. By 1988, that had grown to 30,000. By 1998, 53,300. By 2003, 67,764 square kilometres of cleared forest, larger than West Virginia. In the worst years of the early 2000s, Brazil was losing more than 20,000 square kilometres of rainforest a year, an area close to the size of New Jersey, every year.
Landsat's 30-metre pixels are just fine enough to detect individual clearings and small fires. That is the resolution at which a rainforest's transformation is legible. It is also the resolution at which it becomes possible to do something about it. The Brazilian government's deforestation monitoring system, PRODES, was built directly on Landsat 5 and 7 data, and is the reason satellites can now alert authorities to illegal clearings within days. Deforestation in Brazil has slowed substantially since the early 2000s. It has not stopped, but it has slowed. Landsat is one of the reasons.
Read the full Amazon case study →
4. Las Vegas, desert to metropolis
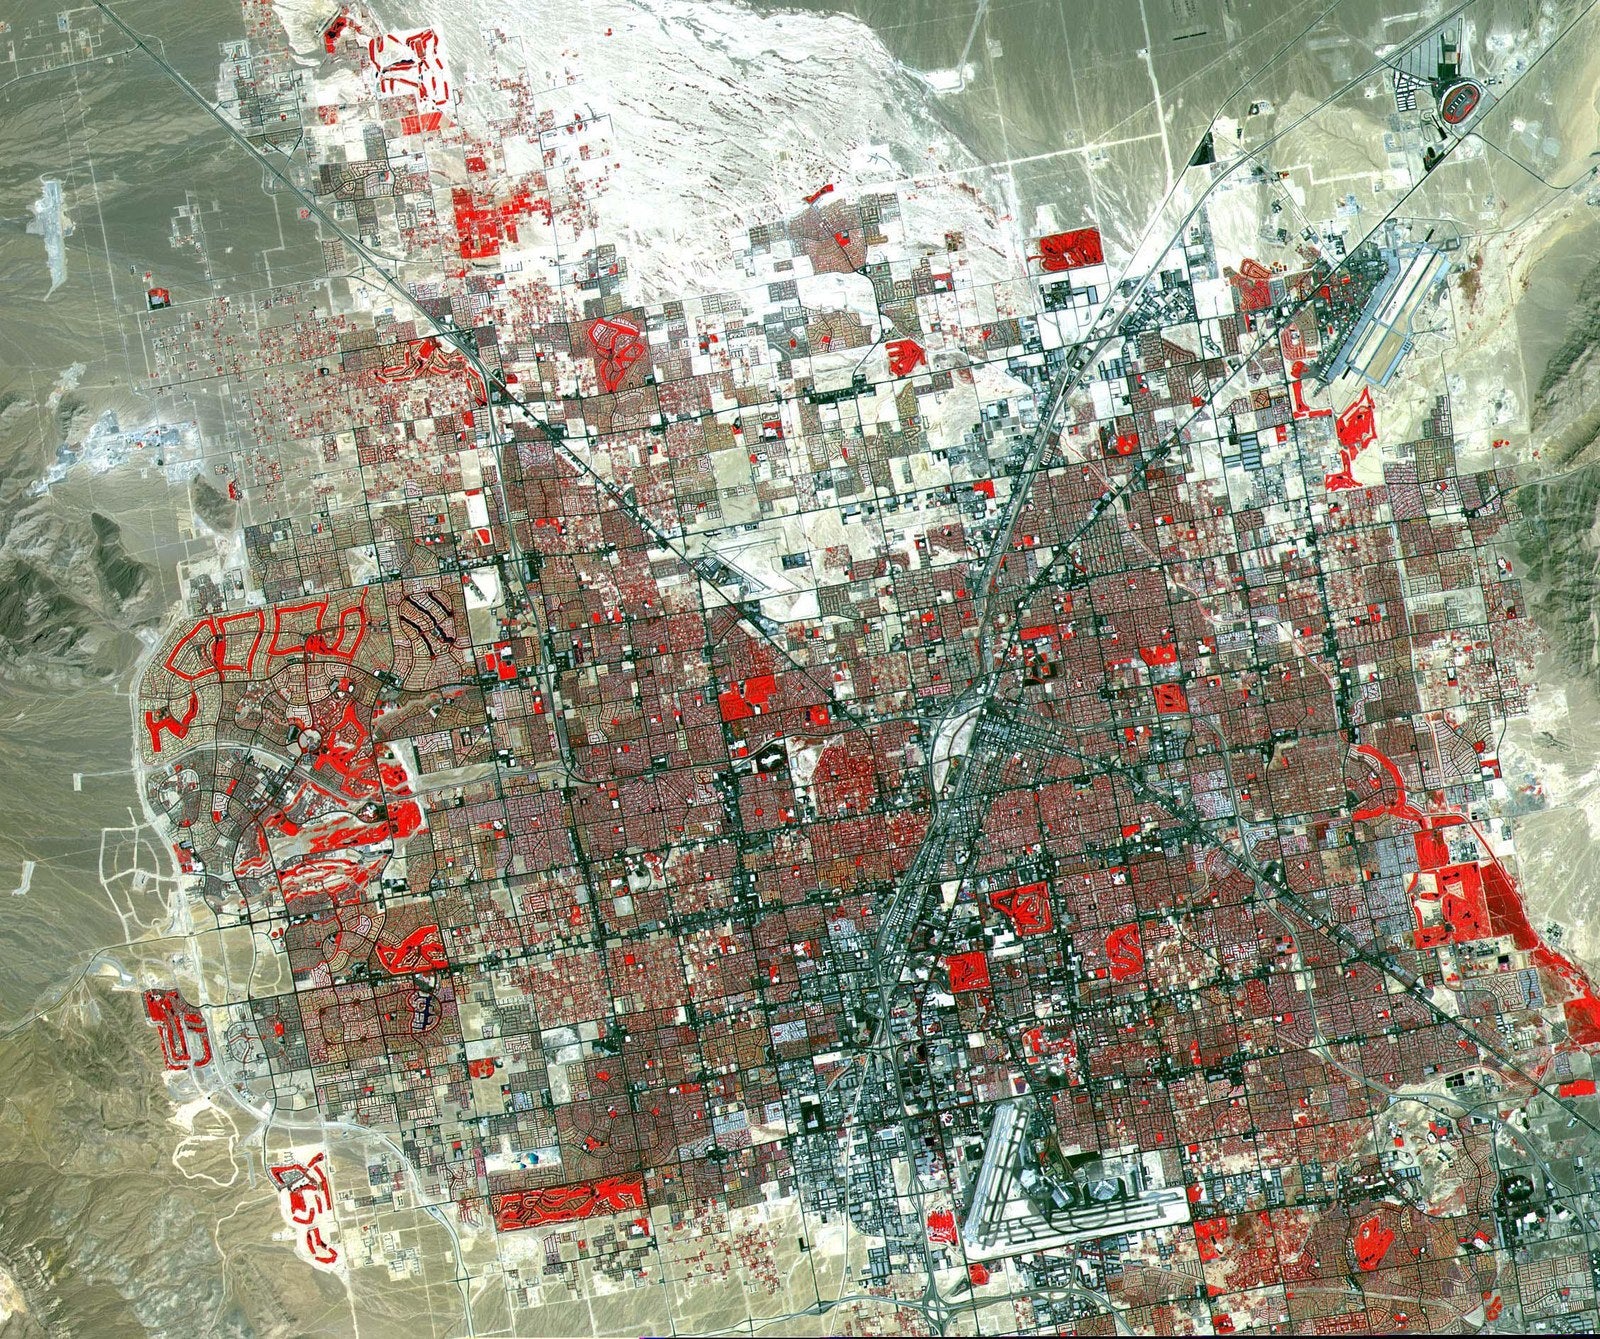
After three case studies of loss and damage, here is one of sheer growth. In 1972, the year Landsat 1 launched, Las Vegas had 358,000 residents. The desert around the city was almost completely intact. Fifty-two years later, the metropolitan area is home to nearly 2 million people, one of the fastest-growing cities in the world. Landsat has watched the entire transformation.
In Landsat's false-colour rendering, the city is unmistakable. Streets and impervious surfaces appear in cool grey. Irrigated parks and golf courses appear in vivid red because chlorophyll reflects strongly in the near-infrared. Bare desert is a soft tan. Put a 1972 frame next to a 2024 frame and no caption is needed. The grey grid has spread across the valley like ink soaking into paper.
The growth was driven by gambling legalisation, the Hoover Dam, and the irrigation infrastructure that made a desert city liveable. All three are visible in the archive. The Hoover Dam shows up as a small bright line in the canyon to the southeast. The irrigation pivots that water the new suburbs show up as small red dots. The casinos themselves are too small for 30-metre pixels to resolve individually, but the urban footprint they sit inside is unmistakable. Landsat does not see the Strip. It sees the city that the Strip built.
Read the full Las Vegas case study →
5. A forest moving north
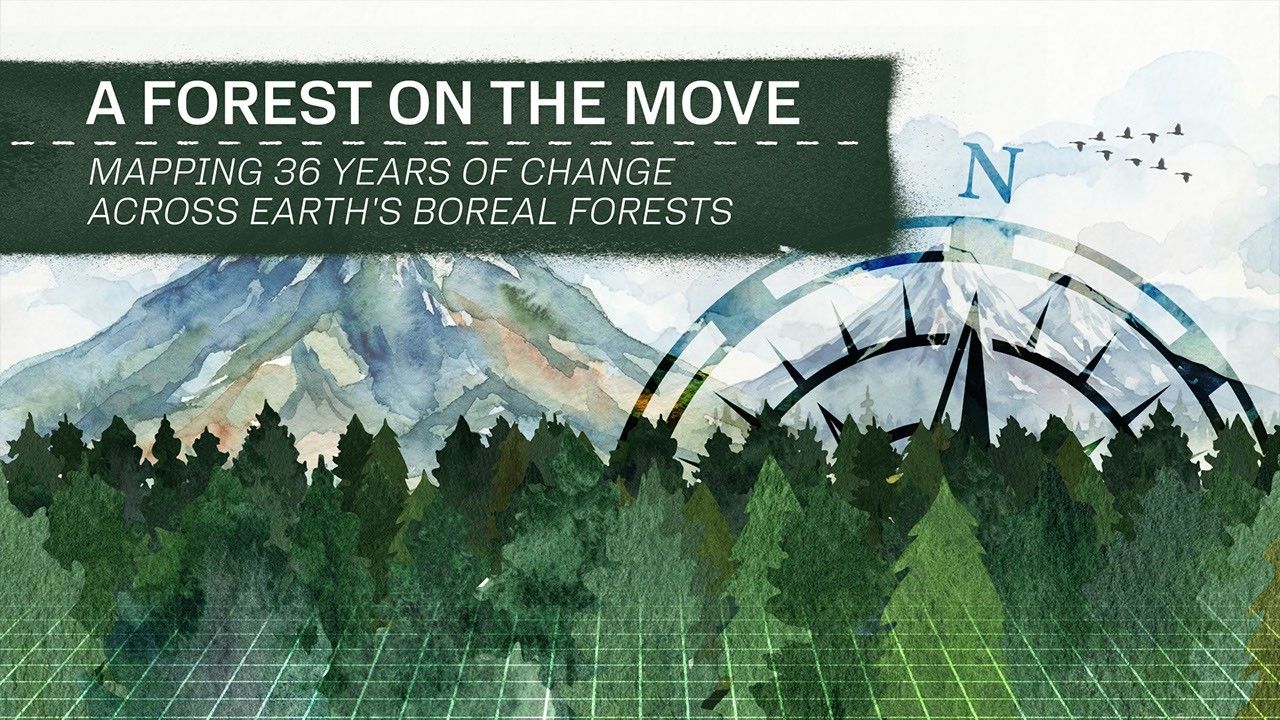
The most surprising story is the most recent. In February 2026, a study published in the journal Biogeosciences used Landsat imagery to prove that the world's largest forest is shifting north. The boreal belt stretches across Russia, Canada, and Scandinavia. It covers more land than any other forest biome on Earth. And it is, slowly, on the move.
The numbers behind the discovery are extraordinary. The researchers used 224,026 individual Landsat scenes, spanning the years 1985 to 2020. They tracked the northern edge of the forest across 36 years of imagery and measured how it had changed. The result: the boreal biome has expanded by 0.844 million square kilometres, a 12% increase, with the gains concentrated between 64 and 68 degrees north. The young new-growth forest holds an estimated 1.1 to 5.9 petagrams of additional carbon, a discovery with direct implications for climate projections.
The biome is warming faster than any other forest type on Earth, and the only reason we know the forest itself is responding in this way is that Landsat has been watching every part of the planet, continuously, since 1972. No other dataset on Earth could have answered this question.
That is what 54 years of an open, calibrated, continuous record buys you. A camera that has been working long enough to see the slow things move.
Read the full boreal forest case study →
What you can do with this
Two things, perhaps, are worth sitting with.
The first is that the archive is open. NASA and the U.S. Geological Survey made the entire Landsat collection free to the public in 2008. Anyone with an internet connection can pull any of millions of frames through the USGS EarthExplorer tool. The frame of your home town from 1985 exists. So does the one from last week. So does the one in between.
The second is closer to home. Every patch of Earth's land is somewhere in the archive, and some of those patches happen to look like the letters of your name. A river bend in Bolivia forms an N. A lake in Indonesia becomes an O. A coastline in Norway shapes an S. NASA proved it themselves with a tool called Your Name in Landsat, which works with any combination of A to Z.
At Skylit Studio we took the same public-domain archive and turned it into a framed print, so the letters of your name can hang on a wall. Made and shipped in the UK. The print is a small piece of the 54-year record of our planet, framed and ready.
See your name written in Landsat → Customise your print
What Is Landsat? → The 50-year photo album of Earth
Earth as Art → When satellite imagery becomes beautiful
Imagery and data: NASA and the U.S. Geological Survey, Landsat programme, public domain. Skylit Studio is not affiliated with or endorsed by NASA or USGS.
Curious how it works? Read our guide to your name in Landsat — how the Earth spells your name in real satellite imagery.